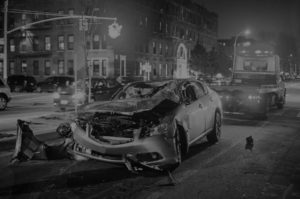
Getting hurt in a motor vehicle crash of any type isn’t just about the physical injuries. Whether you’re a driver or a passenger, you take a risk every time you ride in a car, truck, or bus. Obviously, it doesn’t stop there. You could be riding a motorcycle or even a bicycle and suffer injuries. Just crossing the street could be life-threatening. Ultimately, fear may cause you to suffer emotional harm.
New Jersey’s Crash Data Summary for 2018 came out in September 2019. It analyzes a few different aspects of motor vehicle crashes, including the following:
- Severity of the car, truck, or bus accident
- How the motor vehicle collision occurred
- Location of the crash
- Road surface conditions
- Lights on any roadway systems
Why are statistics valuable at all? For one, they give law enforcement authorities and other government agencies a tool to work with that could prove beneficial. For example, on a local level, that data may show good cause for installing a new traffic light.
Overall Summary of New Jersey Auto Accidents
In Hudson and Essex counties, the increase in motor vehicle accidents was just about two percent. Of, it would be much better to see the numbers go down than up.
Crash Data and Fatal Accidents
In Hudson County, 21 people were killed in some type of vehicular crash in 2018. In Essex County, more than double that number lost their lives.
Statewide, 124 auto-related deaths occurred on municipal roads, while 156 happened on county roadways, such as Secaucus Road, Union City, Jersey City, North Bergen, and Secaucus.
With the exception of toll roads and interstates, 188 fatal accidents occurred on state highways. This would include area roads such as Routes 3 or 7.
How are things now? As of late October 2019, 433 motor vehicle crashes have resulted in 433 dates statewide. Fourteen fatal accidents occurred in Hudson County; 31 deaths were reported in Essex County.
Fatal accidents happen for a variety of reasons. While many think of cellphones as a major threat, the good news is that only one fatal accident was marked as attributable to a handheld device. None were reported as far as relating to handsfree equipment. Perhaps updates in technology with Bluetooth is helping cut down on the severity of cellphone related crashes.
Injuries and Motor Vehicle Crashes
Earlier, you learned that there were over 278K statewide in New Jersey in 2018. While 524 people died as a result of some kind of collision with a car, truck or bus, thousands were hurt. Over 61K individuals reported some type of injury after an accident. Meanwhile, almost 217K drivers dealt with issues related to property damage.
In the meantime, the state evaluated injuries as to severity. At the time the accidents occurred, as little as .33% reported major injuries on municipal roads. However, that’s not to say that things changed down after the initial shock of the crash. On county roadways, the numbers rose to .47% as far as severe injuries.
A review of crashes on non-toll or interstate accidents on state highways showed similar numbers to county roads.
When it comes down to it, approximately 8-9% of motor vehicle crashes have resulted in injuries over the last decade. In previous years, the numbers were even higher.
Where are the Accidents Happening?
In 2018, there were 195 crashes on Route 1 between Mileposts 54.00 and 54.61. Additionally, 27 people reported injuries in that section of the highway in Jersey City. The crash rate is marked at 222.18.
Meanwhile, a fair share of accidents occurs on Route 280 in both Essex and Hudson counties. Over 300 injuries happened as a result of crashes on the roadway between the two counties. And, three people died on Route 280 during 2018.
As you might guess, Route 78, the New Jersey Turnpike, and the Garden State Parkway all come up high when it comes to motor vehicle collisions. Often, high speed and sheer volume make for increased risk factors.
Types of Accidents and Conditions
What do you think tops the list as far as collision types for accidents within a city? More than 25% of collisions occur with parked vehicles. A large percentage of crashes occur between intersections, which would most likely account for the number of angle or “T-bone” accidents.
The statistics regarding surface and lighting conditions are similar on county roads. However, there is one major difference. Over 31% of the motor vehicle crashes on county roads involve rear-end hits of vehicles traveling in the same direction.
Meanwhile, the numbers went up on state highways as far as rear-end accidents to nearly 47%. And, they remained consistent as far as surface and lighting.
What the Numbers Mean
- Fatality
- Partial or Total Paralysis
- Traumatic Brain Injury
- Broken bones (also referred to as fractures)
- Neck or back problems, including herniated discs
- Soft tissue injuries, such as strains and sprains
- Emotional issues
- Amputations
- Chest Injuries
The bottom line is that an accident can happen in any number of ways and leave you with permanent and lasting injuries. If you were a passenger in a motor vehicle collision, it’s almost certain that you did not contribute to it.
Even if you were partially responsible for the crash, you may be owed some percentage of compensation. The court may still evaluate your role in the accident and award you money under a theory of comparative negligence.
If you are hurt in a car accident of any kind, you should be careful about dealing with the insurance company without experienced legal counsel. More than likely, the trauma of the crash can be enough to handle without worrying about anything else.
Contact Us
At the Law Offices of Anthony Carbone, it’s something we’ve done for over thirty years. Call us to learn how we can help you. We will guide you through the process as you heal from your injuries.